EXECUTIVE SUMMARY
Download the Full Report as a PDF here
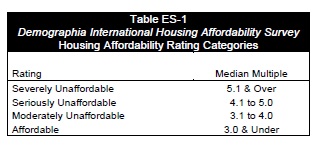
Rating Housing Affordability
The 9th Annual Demographia International Housing Affordability Survey covers 337 metropolitan markets in Australia, Canada, Hong Kong, Ireland, New Zealand, the United Kingdom and the United States. A supplemental analysis of housing affordability in Singapore is also provided, using available data. The Demographia International Housing Affordability Survey employs the “Median Multiple” (median house price divided by gross before tax annual median household income) to rate housing affordability (Table ES- 1). The Median Multiple is widely used for evaluating urban markets, and has been recommended by the World Bank and the United Nations and is used by the Harvard University Joint Center on Housing.
More elaborate indicators, which mix housing affordability and mortgage affordability can mask the structural elements of house pricing are often not well understood outside the financial sector. Moreover, they provide only a “snapshot,” because interest rates can vary over the term of a mortgage; however the price paid for the house does not. The reality is that, if house prices double or triple relative to incomes, as has occurred in many severely unaffordable markets, the sum total of mortgage payments will also rise substantially.
Historically, the Median Multiple has been remarkably similar in Australia, Canada, Ireland, New Zealand, the United Kingdom and the United States, with median house prices having generally been from 2.0 to 3.0 times median household incomes (historical data has not been identified for Hong Kong), with 3.0 being the outer bound of affordability. This affordability relationship continues in many housing markets of the United States and Canada. However, the Median Multiple has escalated sharply in the past decade in Australia, Ireland, New Zealand, and the United Kingdom and in some markets of Canada and the United States. In every market where there has been a sustained and significant increase in the Median Multiple, there has also been the implementation of more restrictive land use policy, which is referred to in this survey as “urban containment” (there are also additional labels, such as “smart growth,” “urban consolidation,” “compact city policy,” “growth management,” and “densification policy”).
The Demographia International Housing Affordability Survey is produced to contrast the deterioration in housing affordability in some metropolitan markets with the preservation of affordability in other metropolitan areas. It is dedicated to younger generations who a have right to expect they will live as well or better than their parents, but may not, in large part due to the higher cost of housing that is driven by exorbitant increases in house prices relative to incomes.
Housing Affordability in 2012
Housing affordability was little changed in 2012, with the most affordable markets being in the United States, Canada and Ireland. The United Kingdom, Australia and New Zealand continue to experience pervasive unaffordability, while the least affordable market is Hong Kong.
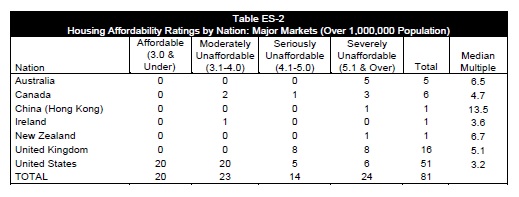
Major Metropolitan Markets: The 337 markets include 81 major metropolitan markets (those with more than 1,000,000 population).
Among these major metropolitan markets, there were 20 affordable major markets, 23 moderately unaffordable major markets, 14 seriously unaffordable major markets and 24 severely unaffordable major markets. All 20 of the affordable major markets were in the United States while two of the moderately unaffordable markets were in Canada and one in Ireland with the other 17 in the United States. All of the major markets of Australia, New Zealand and Hong Kong were severely unaffordable. One-half of the major markets in Canada and the United Kingdom were severely unaffordable, while only six of the 51 major US markets were severely unaffordable (Table ES-2).
The most affordable major market was Detroit, with a Median Multiple of 1.5, below the historic range of 2.0 to 3.0, reflecting the depressed nature of its economy. Atlanta had a Median Multiple of 2.0 and is experiencing strong demand from a recovering US housing market. Among the other 16 affordable major markets, the lowest Median Multiples were in Cincinnati, Rochester, St. Louis, Cleveland, Indianapolis and Jacksonville. Dallas-Fort Worth and Houston, which are the fastest growing markets with more than 5,000,000 population included in the Survey.
The most unaffordable major market was Hong Kong, with a Median Multiple of 13.5. (ranked 81st). Vancouver ranked second most unaffordable, at a Median Multiple of 9.5 (80th). Sydney was the third most unaffordable, at 8.3 (79th). San Jose had a Median Multiple of 7.9 (78th), San Francisco and London 7.8 (76th). and Melbourne 7.5 (75th).