| Year | Manitoba | Saskatchewan | Alberta | Canada Avg. |
| 1975 | $414 | $358 | $419 | $402 |
| 1976 | $484 | $423 | $481 | $461 |
| 1977 | $534 | $470 | $503 | $499 |
| 1978 | $566 | $502 | $558 | $544 |
| 1979 | $611 | $567 | $664 | $601 |
| 1980 | $714 | $670 | $757 | $687 |
| 1981 | $835 | $782 | $890 | $804 |
| 1982 | $972 | $938 | $1,083 | $934 |
| 1983 | $1,075 | $1,037 | $1,214 | $1,029 |
| 1984 | $1,142 | $1,096 | $1,254 | $1,092 |
| 1985 | $1,211 | $1,166 | $1,348 | $1,165 |
| 1986 | $1,306 | $1,288 | $1,455 | $1,247 |
| 1987 | $1,394 | $1,329 | $1,443 | $1,327 |
| 1988 | $1,482 | $1,428 | $1,488 | $1,426 |
| 1989 | $1,607 | $1,598 | $1,617 | $1,539 |
| 1990 | $1,767 | $1,781 | $1,701 | $1,644 |
| 1991 | $1,809 | $1,827 | $1,757 | $1,764 |
| 1992 | $1,889 | $1,817 | $1,840 | $1,825 |
| 1993 | $1,872 | $1,723 | $1,816 | $1,817 |
| 1994 | $1,886 | $1,769 | $1,703 | $1,822 |
| 1995 | $1,932 | $1,802 | $1,578 | $1,805 |
| 1996 | $1,930 | $1,833 | $1,609 | $1,783 |
| 1997 | $2,008 | $1,938 | $1,743 | $1,838 |
| 1998 | $2,100 | $2,053 | $1,837 | $1,946 |
| 1999 | $2,340 | $2,214 | $2,049 | $2,059 |
| 2000 | $2,635 | $2,340 | $2,242 | $2,198 |
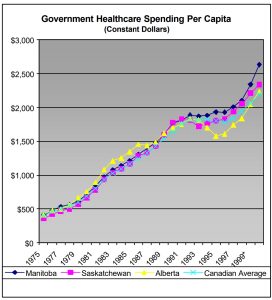
OBSERVATIONS:
- The Manitoba government spends almost 20% more per capita on health care than the rest of Canada. If per capita spending was at the Canadian average it would spend about $500 million less than it presently does.
- Manitoba spends 12.6% more per capita on health care than Saskatchewan and 17.5% more than Alberta. Although Alberta’s population is younger on average, no demographic disparity explains the spread between health-care spending in Manitoba and Saskatchewan.
- The average annual increase in government health-care spending in Canada is 7.5% a year over the last 25 years, in constant dollars.
- After governments hit the debt wall in the early 1990s, the rate of increase tapered off considerably. For the years 1992-1997, the average annual increase was only 0.9%. Expansion of federal transfer payments in subsequent years have returned spending patterns to near average levels, and new increases only recently announced confirm a return to large annual increases in spending on health care.
- Data on the current state of hospital crowding, waiting lists, delays and denials of medical procedures do not yet indicate a significant increase in health-care outcomes, despite accelerating spending levels.
Read in PDF format here.