 Intergovernmental Panel on Climate Change (IPCC) science deliberately kept public focus on warmer temperatures and blamed it all on radiative forcing due to CO2. They virtually ignore water in all its forms, partly because terms of reference directed them to only human causes and because any consideration of the role of water destroys the CO2 hypothesis.
Water explains many elements of weather as reflected in the response of plants and animals, but they even perverted that evidence.
Classification: Sort The Data
Carolus Linnaeus’ classification system that named, ranked and classified organisms was a major advance in biology. Vladimir Koppen produced a climate classification system in 1884 that named ranked and classified climates based on the distribution of plants.
In the simplest form of classification there are nine major climate zones (Figure 1). Zones 1, 3, 7 and 9 are singular with similar weather conditions all year influenced by one major control mechanism. The others, 2, 4, 5, and 6 are mixed weather conditions because they’re under different control mechanisms as the seasons change.
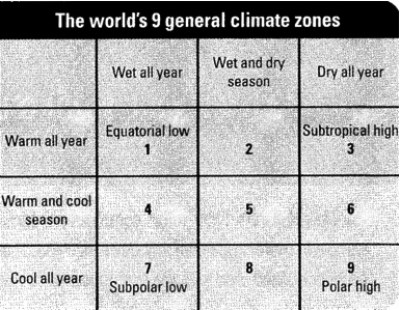
Figure 1: Which region are you in?
Koppen created a system around these basic divisions based on average annual precipitation, average monthly temperature and average monthly precipitation. He identified six major divisions.
A. Tropical Humid
B. Dry
C. Mild mid-latitude
D. Severe Mid-latitude
E. Polar
H. Highland (added later).
These were subdivided into second and third divisions.
B classification is the only one initially determined by annual precipitation. If it is not a B climate then it is one of the other classifications. The amount of precipitation must be sufficient to support trees. Thus a desert is not defined by temperature, but by lack of vegetation. Koppen recognized another important issue called the effectiveness of precipitation.
A portion of rainfall is evaporated, what remains goes into the ground and is available for the plants. Koppen divined what was effective, that is available for the plants, by identifying three different annual patterns: rainfall year round, 70% in the summer or 70% in the winter. Each may have the same annual total but the amount left for the plants varies considerably.
So the B Climate cannot support trees, but Koppen uses a sub-classification letter to separate regions that support grasses BS (for steppe grasslands) from no vegetation at all, BW. A third letter separates h (hot) or k (cold). A desert is hot or cold defined by the lack of vegetation, not temperature.
Koppen modified his system, with revisions in 1918 and 1936, the last was 52 years after his first publication. He was not done. He died in 1940 at the age of 90 but not before he had produced a more sophisticated system with another every important early climatologist, Rudolf Geiger. It is called the Koppen-Geiger system and is still used (Figure 2).
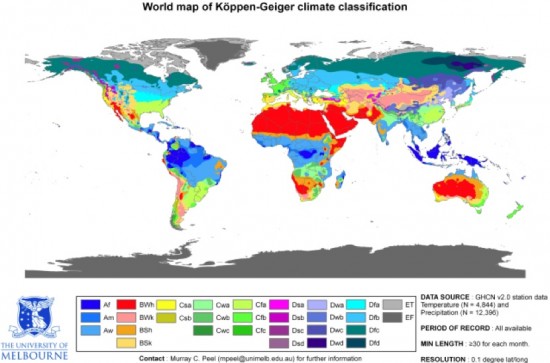
Figure 2: The generally linear pattern of climate is clear.
Geiger’s valuable book Climate Near the Ground published in 1950 was an important contribution to climate science that few know about, but that requires another column.
Practical Climatology
Another name little known even to many latter-day climatologists is Charles Thornthwaite (1889-1963). In 1931 he produced a classification also based on precipitation effectiveness and vegetation. It was valuable because it was produced from easily available data, total monthly precipitation (P) and evaporation (E) to produce a P/E Index. He modified it in 1948 by including a moisture index that relates the amount of moisture a plant needs to the amount available, known as the Potential Evapotranspiration (PE). (Evapotranspiration is the combined moisture loss from the surface. Either directly, due to evaporation, or indirectly transpired through the plant to the atmosphere.)
In 1946 he opened the Laboratory of Climatology in New Jersey and worked there until his death in 1963. John Mather joined him and they produced a revised system in 1955 that is the basis of most practical applications of climate work in the world today. Everyone from irrigators to hydrologists use variations of the model for their work. For example, a paper studied the viability of predicting stream flow in Costa Rica and concluded; “These results indicate that the Thornthwaite method can be satisfactorily applied to estimate mean monthly stream- flow in the uplands of Costa Rica.”
Another study used the model for Stormwater Management Planning in Ontario.
The contributions of Thornthwaite to practical applications of climate were summarized in a 1996 biography, The Genius of C. Warren Thornthwaite, climatologist-geographer.”
Other methods of calculating moisture developed since Thornthwaite are mostly directed to assessing drought. These include the Palmer Drought Index, which estimates dryness from precipitation and temperature data. It is used by the US and Canadian governments among others and NOAA publishes a weekly Palmer Index.
IPCC Reports say little, but acknowledge lack of data and understanding. “There are very limited direct measurements of actual evapotranspiration over global land areas. Over oceans, estimates of evaporation depend on bulk flux estimates that contain large errors.” The problem is this is the major mechanism of transferal of heat energy in the global system.
They only make one dismissive comment about Thornthwaite’s work.
In his book, Climate Change: A Natural Hazard, William Kininmonth, former head of Australia’s National Climate Centre says, “The simple one-dimensional energy balance model used by the IPCC to justify its radiative forcing hypothesis is unrealistic in its portrayal of processes at the earth-atmosphere interface.” The IPCC model suggests that the heat and latent energy exchange between the underlying surface and the atmosphere is a direct response to the imbalance of solar energy and terrestrial radiation at the surface. Such a proposal is at odds with the physics of the surface energy exchange processes.” It’s one of many errors made to achieve a result; actions that are the opposite of even poor science.