Last year, the Organization for Economic Cooperation and Development (OECD) published research showing that the middle-class is shrinking throughout the developed world. In Under Pressure: The Squeezed Middle-Class, OECD emphasized that the threat to the middle-class is the result of costs of living that have risen well ahead of incomes.
OECD added: “…the current generation is one of the most educated, and yet has lower chances of achieving the same standard of living as its parents.”
Cost of Living is Largely Defined by the Cost of Housing
Noting that house prices have been growing three times faster than incomes in the last two decades, OECD found that “housing has been the main driver of rising middle-class expenditure.” Moreover, OECD noted that the largest housing cost increases are in home ownership, not rents.
French economist Thomas Piketty has shown that wealth inequality had substantially increased in recent decades. Examining Piketty’s data, Matthew Rognlie, of Northwestern University, found that the principal component in the greater inequality was rising houses prices, the very issue cited by OECD.
Housing largely determines the cost of living. For example, in the United States, more than 85% of the higher cost of living in the most expensive US metropolitan areas is in housing (Figure 1).

Not surprisingly, housing affordability has become a principal domestic policy issue, with frequent pronouncements by government officials and others.
Housing Affordability: The Relationship Between House Prices and Incomes
Fundamentally, housing affordability is not about house prices; it is about house prices in relation to household incomes. Housing affordability cannot be assessed without metrics that include both prices and incomes.
Higher housing costs drive up the need for subsidized housing.
There is also considerable discussion about “affordable housing,” which is subsidized or social housing, also referred to as ‘low-income housing.’ This may seem unrelated to middle-income housing, but there is a very real connection.
In most places, eligibility for subsidized housing is at least partly determined by a household’s ability to afford housing costs in the market. This means that as housing affordability worsens in the market, more households become eligible for “affordable housing.”
The tragedy is that in many metropolitan areas, there is not nearly enough “affordable housing” to meet the need. Indeed, in many metropolitan areas, households needing subsidies may have to spend years on waiting lists because higher housing costs drive up the need for subsidized housing.
The Demographia International Housing Affordability Survey
For 16 years, Hugh Pavletich of Performance Urban Planning and I have published the Demographia International Housing Affordability Survey, which rates middle-income housing affordability in more than 300 metropolitan areas. This includes 90 major metropolitan areas (over one million population).
This article focuses on the nations that we have covered for 15 years (since the second edition in 2006), each of which is included in OECD’s Under Pressure: The Squeezed Middle-Class (Australia, Canada, Ireland, New Zealand, the United Kingdom and the United States).
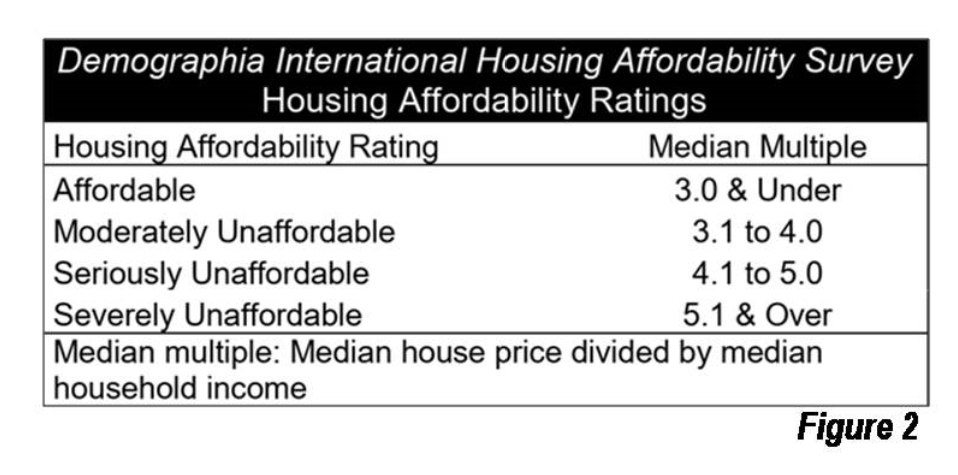
Demographia rates housing affordability using the “median multiple” (a price-to-income ratio), which is the median house price divided by the median household income (Figure 2).
The Housing Affordability Deterioration in Six Nations
For the first quarter century after World War II, the median multiple tended to be 3.0 in nearly all major metropolitan areas in the six nations. In 1970, few major metropolitan areas had median house prices greater than three times the median household income and none were severely unaffordable.
During the next two decades, Sydney, San Francisco, San Diego, Los Angeles, and San Jose became severely unaffordable in the six nations. The price-to-income ratios of the six nations remained at 3.0 or less between 1989 and 1992.
By 2019, one third (30) of the major metropolitan markets had become severely unaffordable.
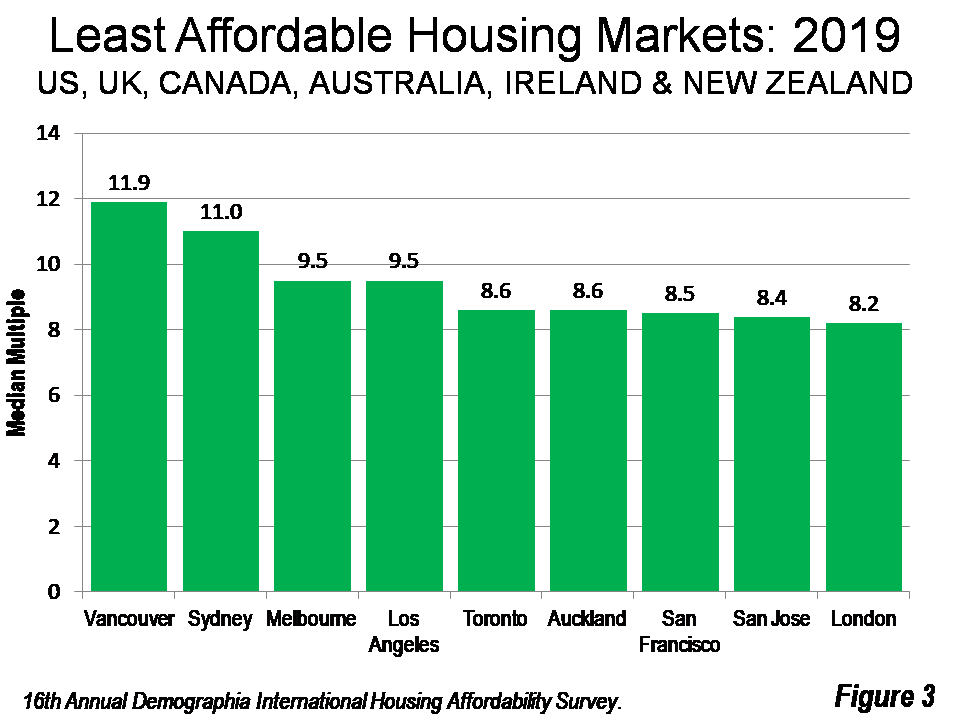
Housing affordability has deteriorated much more strongly in some metropolitan areas. In 2019, the worst housing affordability (Figure 3) was in Vancouver, with a median multiple of 11.9, followed by Sydney (11.0), Melbourne (9.5), Los Angeles at (9.0), Toronto and Auckland at (8.6), San Jose (8.5), San Francisco (8.4), and London (8.2).
Housing Affordability by Nation
All of the major metropolitan markets in Australia had become severely unaffordable by 2019: Sydney, Melbourne, Brisbane, Perth, and Adelaide.
New Zealand’s one major market, Auckland was severely unaffordable.
Ireland’s one major market, Dublin, was rated as seriously unaffordable.
In the United Kingdom, 8 of 21 major markets were rated severely unaffordable. These include London, the London Exurbs (outside the Green Belt), Bristol, Dorset, Leicester, Northampton, Devon, and Wiltshire.
Two of Canada’s five major markets are also severely unaffordable: Vancouver and Toronto.
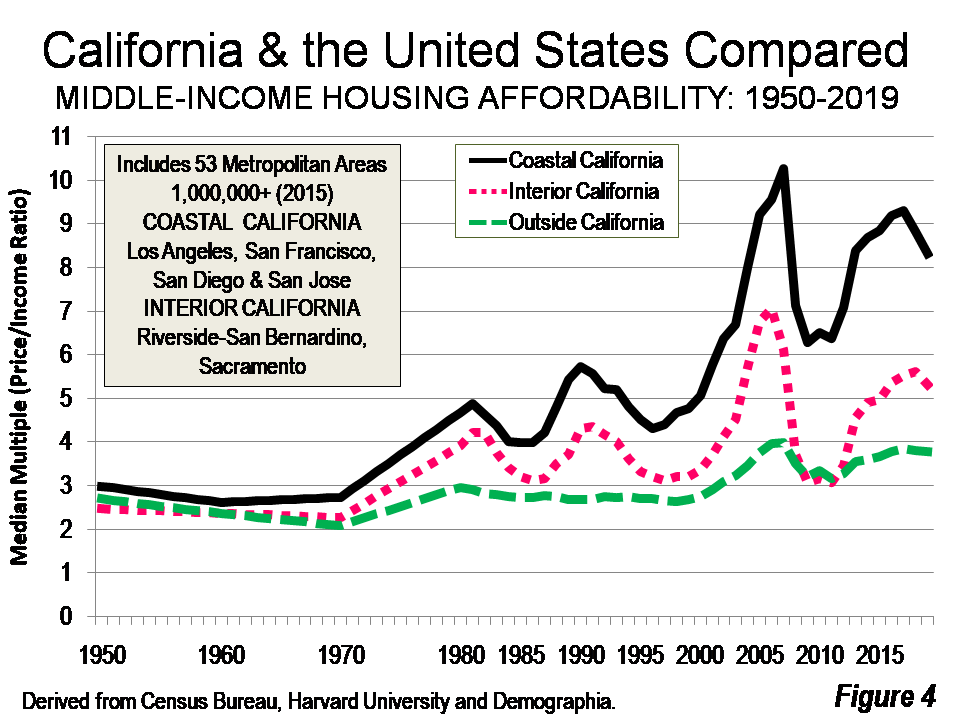
California is the disaster zone of the United States. All six of its major markets were severely unaffordable (Figure 4). This includes the four least affordable U.S. markets, Los Angeles, San Francisco, San Diego, San Jose; as well as Riverside-San Bernardino and Sacramento. In addition, Portland, Oregon, Seattle, Denver, Miami, New York, and Boston were severely unaffordable.
Regulation-Driven Housing Affordability
There is broad agreement among economists that deteriorating housing affordability is related to stronger land use regulation. There are so many varieties of land use regulation that Keith Ihlanfeldt of Florida State University divided the list into six broad categories. The Wharton Residential Land Use Regulatory Index rates land-use regulatory stringency in U.S. metropolitan areas. It has been frequently cited to demonstrate the association between greater regulation and higher housing costs.
However, not all land use regulations are the same. For example, regulating the color of building materials in a suburban jurisdiction is not likely to produce much difference in housing affordability within a metropolitan area, much less between metropolitan areas.
On the other hand, prohibiting or severely limiting new urban fringe housing in a metropolitan area severely reduces the land on which development is allowed. This distorts housing markets and probably worsens housing affordability more than other regulations.
The most frequently recurring strategy of urban containment policy is the urban growth boundary, beyond which new housing is either prohibited or severely limited. According to urban planners Arthur C. Nelson and James B. Duncan, “Urban development is steered to the area inside the line and discouraged (if not prevented) outside it.”Nelson, Thomas W. Sanchez and Casey J. Dawkins contrast urban containment with “…traditional approaches to land use regulation by the presence of policies that are explicitly designed to limit the development of land outside a defined urban area…”
Urban containment policy also includes “virtual urban growth” boundaries which consist of large lot (rural) zoning on the urban periphery. These regulations make it impractical for the market to build middle-income housing.
All of the 30 major metropolitan areas rated as severely unaffordable in the Demographia International Housing Affordability Survey have urban containment.
How Urban Containment Drives Up Land Prices
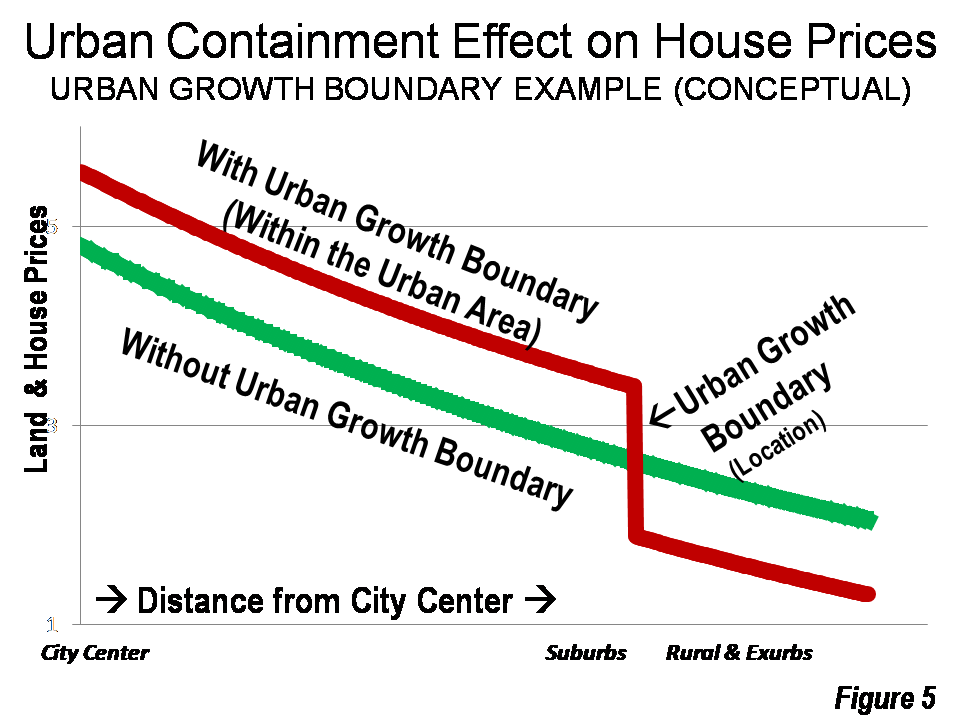
Harvard University’s William Alonso showed that the value of land tends to rise from the low agricultural values outside the built-up area, peaking at the urban center(s). In contrast, an abrupt increase in land values typically occurs at the urban growth boundary, with far higher land values on the developable side. The is illustrated by Figure 5, which generally compares the land value gradient with and without an urban growth boundary; the latter of which increases land values throughout the developed area. This figure is derived from similar representations, such as by Gerrit Knaap and Arthur C. Nelson, William A. Fischel and Gerard Mildner.
Planners had hoped for densification within urban growth boundaries that would reduce land costs enough to maintain housing affordability. However, this has not occurred and housing affordability has worsened materially, as is indicated above.
The Costs of Urban Containment
Abrupt increases in land values at the urban growth boundary are documented in academic studies. Gerald Mildner of Portland State University found that land prices for comparable land parcels tended be 10 times or more higher to the outside of Portland’s urban growth boundary.
Former Chairman of the Board of the Reserve Bank of New Zealand, Arthur Grimes, and Yun Liang of Motu Economic and Public Policy Research found that comparable parcels were from 8 to 13 times as expensive outside Auckland’s urban growth boundary. Mariano Kulish, Anthony Richards, and Christian Gillitzer of the Reserve Bank of Australia show that when farmland is included “or is considered for inclusion” within the Melbourne’s urban growth boundary, its value increases between 12 and 20 times.
Edward Glaeser of Harvard University and Joseph Gyourko of the University of Pennsylvania have shown the extent to which intense regulation can drive up house prices. Glaeser and Gyourko found the actual median house value in the San Francisco metropolitan area to be 184% more than the minimum profitable production cost (MPPC), which includes land, construction costs, and entrepreneurial profit. This is at least $500,000 higher than would be expected with traditional regulation. Included in this is a 10 times increase in land values of $440,000 (85%), consistent with the abrupt increases at urban growth boundaries noted above.
Some urban containment proponents blame the high San Francisco Bay Area house prices on a shortage of developable land. In fact, there is ample developable land, well located relative to both the urban core and the highly dispersed jobs in the nine central counties. However, urban containment largely prohibits building on nearly all of this land. Households, however, have not been deterred, and are moving even farther out. Commuting patterns have become so strong from places like Stockton and Modesto that the U.S. federal government has added three Central Valley counties to the San Francisco Bay Area metropolitan region, up to 150 miles (250 kilometers) from the San Francisco urban core.
Metropolitan areas that allow houses to be built for minimum profitable production costs are not likely to have housing shortages. Moreover, until urban containment, housing shortages were at worst temporary. On the other hand, urban containment reduces the standard of living for middle-income households by housing costs that are higher than necessary.
Worse urban containment is associated with increased poverty, as higher house prices forces more households to seek low-income subsidies, which are routinely under-supplied.
The Consequences of Urban Containment
A prerequisite to maintaining the middle-income standard of living and reducing poverty is keeping housing costs from rising faster than incomes. Without reform, housing affordability is likely to worsen further, both within the severely unaffordable markets and less unaffordable markets that have not yet become severely unaffordable.
The COVID-19 pandemic is a further threat to the middle-class. Millions of people have been driven into unemployment around the world. The U.S. unemployment rate already rivals the worst rates of the Great Depression. The COVID-19 crisis could substantially worsen housing affordability and reduce the standard of living for both middle-income and lower-income households.
There is an urgent need for reform. Paul Cheshire, Max Nathan, and Henry Overman of the London School of Economics have suggested that urban planning needs to become more people-oriented. They suggest “that the ultimate objective of urban policy is to improve outcomes for people rather than places; for individuals and families rather than buildings.” Fabled urbanist Jane Jacobs expressed the same sentiment in her final book: “If planning helps people, they ought to be better off as a result, not worse off.” Yet, urban containment, a principal planning strategy, has been associated with worsened housing affordability. Urban containment has made people worse off.
Not only should urban containment regulations be rolled back, urban containment regulation holidays should be declared, at least until pre-pandemic economies and employment levels have been fully restored. Otherwise, the middle-class will be squeezed even further.
Republished from Meeting of the Minds www.meetingoftheminds.org
Wendell Cox is a Senior Fellow with the Frontier Centre for Public Policy with expertise in housing affordability and municipal policy.


