Following a recent newgeography.com column “Toronto Solidifies Highest Density Ranking in North America,” I received comments of disbelief, at the fact that the urban density of the Winnipeg urban area is above that of the New York City urban area. This is based on the latest available data from Statistics Canada and the United States Census Bureau (Figure 1).
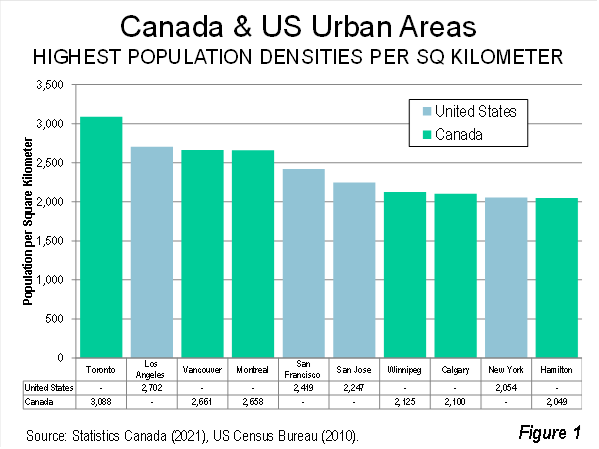
Summary of the Data: According to the 2021 Census, the Winnipeg PC had a density of 2,125 residents per square kilometer. By contrast, the latest data, from the US 2010 census, shows that the New York UA had a density of 2,054 per square, about three percent below that of Winnipeg. The data for Winnipeg and New York is in Figure 2, as well as Toronto and Los Angeles, the densest PCs/UAs in Canada and the United States. Additional information on Toronto, Los Angeles and New York is in Note 3.
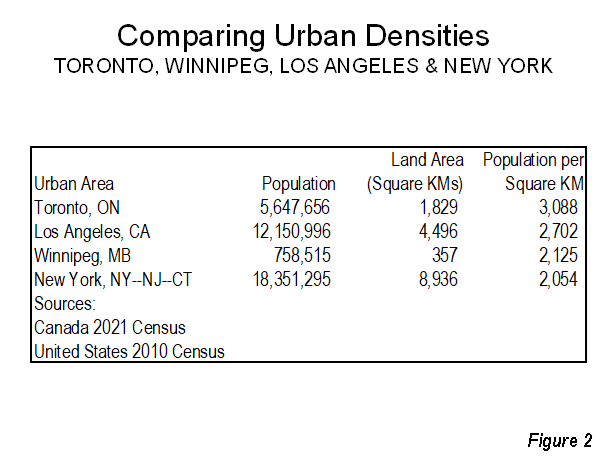
PCs/UAs are composed of the smallest census geographies, and do not conform to any political boundaries. They are developed irrespective of state, provincial, city, regional municipality or other local or regional government boundaries. PCs/UAs are the highest geographical level at which urban density can be reasonably calculated, because any larger area would include rural areas. In both nations, all land outside PCs/UAs is rural. Additional PC/UA background is in Note 2.
Misunderstanding Urban Densities: The media and sometimes even academics can profoundly mischaracterize urban densities. Much of the difficulty arises from confusion about geographical terms. Reports and articles sometimes compare population densities of “cities” (municipalities) with metropolitan areas, metropolitan areas with urban areas, etc. These are very different geographies and can no more be validly compared than apples and oranges.
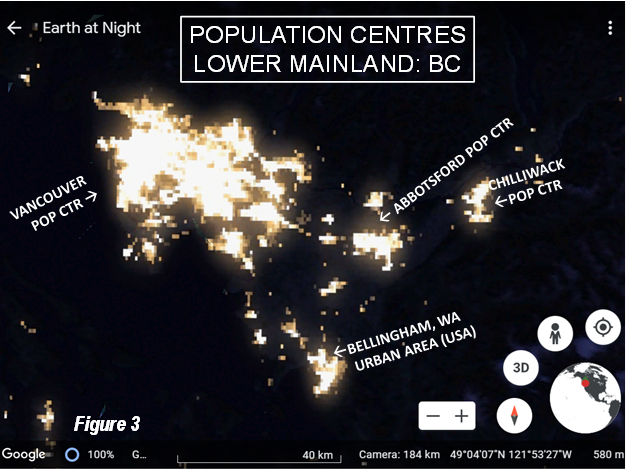
Urban Areas (Population Centres): Urban areas are continuously developed urbanization. In Canada, they are called “population centres” (PC) and in the US “urban areas” (UA). A PC/UA is generally outlined by the lights one would see from a high flying airplane on a clear night. This is illustrated in Figure 3 (map source Google Earth), which shows urban areas in the Lower Mainland area of British Columbia. By far the largest is the Vancouver urban area, which includes such municipalities as Vancouver, Richmond, Burnaby, Surrey, New Westminster, etc. Metropolitan areas (called Census Metropolitan Areas or CMAs in Canada) are organized around their largest PCs/UAs.
Cities (Municipalities): Cities (municipalities) are local government jurisdictions, such as the city of Vancouver, Winnipeg, Toronto or New York. Generally, municipalities are within an urban area and a metropolitan area. But there is little statistical relationship between the population of large municipalities and the urban areas or metropolitan areas that share their names. For example:
- The city of Vancouver comprises 27% of the Vancouver PC population and 25% of the Vancouver CMA population.
- The city of Calgary has slightly more than 100% of the Calgary PC population and 89% of the Calgary CMA.
- The city of Winnipeg comprises 99% of the Winnipeg PC population and 90% of the Winnipeg CMA population.
- The city of Toronto has 49% of the Toronto PC population and 45% of the Toronto CMA population.
- In the United States, the city of Atlanta comprises only less than 10% of the Atlanta urban area and metropolitan area population.
- In perhaps the most extreme case, the city of Melbourne (Australia) comprises only 3% of either the urban area or metropolitan area population.
Metropolitan Areas (CMAs): Metropolitan areas are organized around PCs/UAs, and include the largest PC/UA, along with the rural and smaller PCs/UAs from which significant number of employee commute into the largest PC/UA. It is possible to calculate metropolitan area densities, but this is of no use for analyzing urban issue, because metropolitan areas are both urban and rural. Their physical expanse is routinely much larger than the urban areas around which they are organized. For example:
- The Toronto PC covers 31% of the Toronto CMA land area.
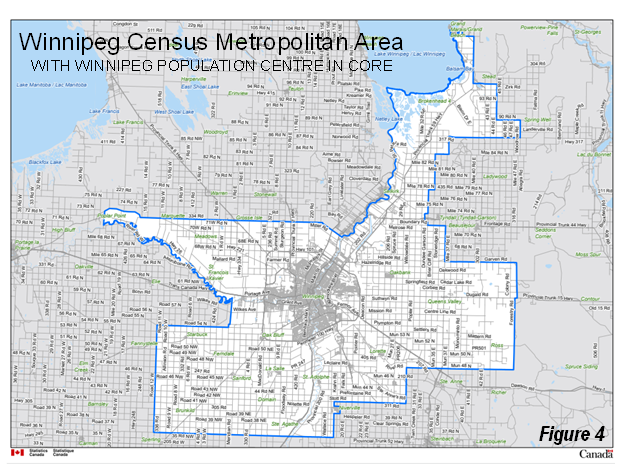
- The Winnipeg PC covers 7% of the Winnipeg CMA land area. Figure 4 from Statistics Canada, illustrates the Winnipeg CMA, which stretches all the way to Lake Winnipeg, while the general outlines of the Winnipeg PC can be identified from the dense street pattern in the center of the map..
- The Los Angeles UA covers 37% of the Los Angeles metropolitan area.
- The New York UA covers 51% of the New York metropolitan area.
- Perhaps the extreme example is the Riverside-San Bernardino (California) UA, which with nearly 2,000,000 residents in 2010, covered only 2% of the metropolitan area’s land area.
Metropolitan area densities should never be used as a proxy for urban densities, because they are not urban, but rather urban and rural.
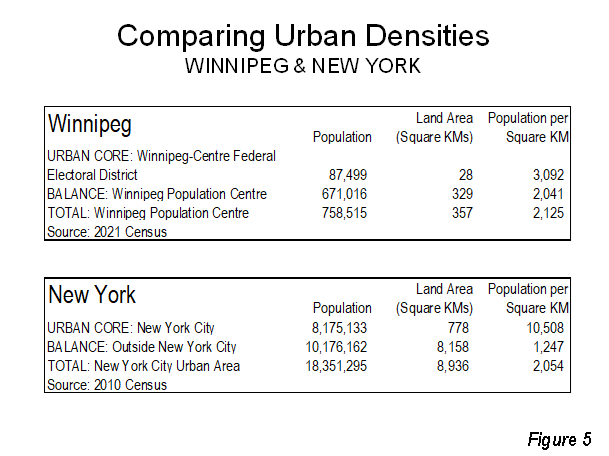
Inside Winnipeg and New York: The population densities within the Winnipeg PC and the New York UA are compared in Figure 5. While the New York urban core has far higher urban density than that of Winnipeg, Winnipeg’s far higher densities outside the urban core more than make up the difference, leaving the Winnipeg PC slightly denser than the New York UA.
The core city of the New York UA is used as the urban core of the New York UA. In the Winnipeg PC the Winnipeg-Centre Federal Electoral District is used as the urban core.
In the New York UA, the urban core has a population density of 10,500 per square kilometer. This is about 3.5 times the density of the Winnipeg PC.
In the New York UA, the population density outside the urban core is only about 1,247 per square kilometer, nearly 40% below the Winnipeg density outside the urban core (2,041). Thus, despite having the largest and densest urban core in Canada or the United States, the far lower density of its expansive suburbs reduces the New York UA density to lower than that of the Winnipeg PC.
Closer comparisons will be possible when the US Census Bureau releases the 2020 Census urban area data, so that the gap between the two data sets will be only one year.
Note 1: Cautions: The Canadian and US data is from the most recent census data, but the years of the data are different in the two nations. The Canadian data is from the 2021 census. The US data is from the 2010, because the urban area data has not yet been released from the 2020 census. Census schedules make comparison of the same years impossible. Canada conducts a census every five years, while the US census is every 10 years. Once the 2020 US Census data for urban areas is available, the results can be compared to the 2021 Canada census data. Interim data is not published, because PC/UA land areas are only delineated in the censuses.
Note 2: Background on Population Centres/Urban Areas: Population centres/urban areas are “built up” from the smallest census enumeration districts. In Canada, these are the 498,786 “dissemination blocks,” which in 2021 had an average population of 74. The United States uses 11,078,297 “census blocks,” which in 2010 had an average population of 27. In both nations, these census areas are far smaller than political jurisdictions, such as cities, smaller than postal cost or ZIP code areas and smaller than census tracts. All areas outside population centres/urban areas are rural.
The two nations use similar population density thresholds for inclusion of enumeration districts in an urban area. Generally, enumeration districts require a density of 400 per square kilometer in Canada (1,036 per square mile). In the US, enumeration districts require a density of 386 per square kilometer (1,000 per square mile). Most nations that delineate PCs/UAs principally rely on the 400 per square kilometer population density threshold.
Canada conducts a census every five years, with the latest in 2021, from which data has been released for population centres. US censuses are conducted every 10 years, however the latest urban area data released is from the 2010 census.
Urban areas are called various other names in other countries, such as Built Up Urban Areas in the United Kingdom Unites Urbaines in France and Urban Centres in Australia. The generic international English term is urban areas.
Note 3: Elaboration on Los Angeles, New York and Toronto: For decades, planners and others have demeaned Los Angeles for urban sprawl. However, Los Angeles sprawls the least among the larger UAs in the United States, in having the smallest amount of land per resident (highest urban density). The Los Angeles UA covers about 50% less land area than the New York UA, but about a third less population. However, with its higher density than Los Angeles, the Toronto PC is the least sprawling large PC/UA in Canada or the US — no larger PC/UA covers less land per resident..
The conception that New York is denser betrays a fundamental misunderstanding of census geography. True, parts of the New York urban area contain the highest densities in the United States. But New York’s urbanization is overwhelmed by its vast lower density expanse of suburbanization, which are 91% of the land area. The suburbs cover about 8,150 square kilometers, having an urban density of approximately 1,250 per square kilometer. By contrast, the suburbs of Los Angeles cover 3,400 square kilometers and have a population density of nearly 2,450 per square kilometer. None of the largest urban areas in the United States is as dense as the suburbs of Los Angeles.
No urban area sprawls like New York. As defined by the US Census Bureau, the New York UA is larger than the states of Delaware and Rhode Island combined. It is also more than one-half larger than the province of Prince Edward Island.


