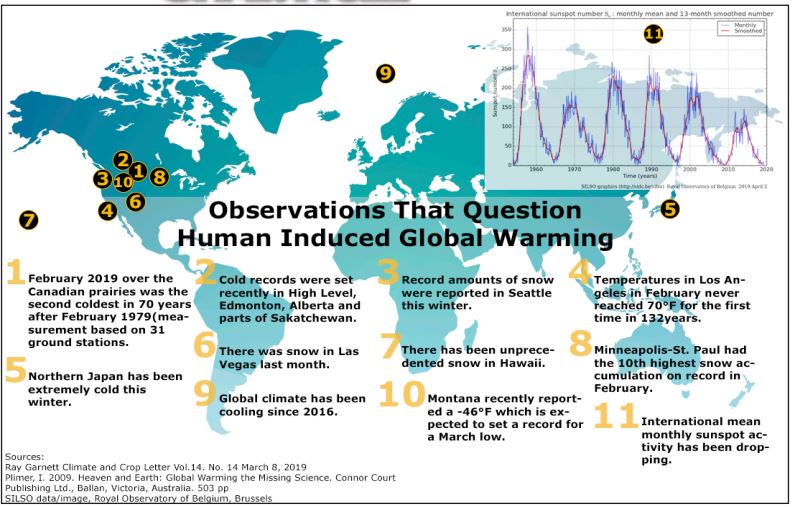
Based on a running centered 13-month average, global temperatures have cooled about 0.3 Celsius since 2016.[1] Similarly, mean monthly sunspot activity has been dropping since 2016: 52 in 2016, 26 in 2017, 12 in 2018 to 4 in agricultural year 2019 (September to...
Charticle
Manitoba First Nation Chiefs’ Wage Disparity
In the age of transparency, fairness, and equity this infographic demonstrates how spectacularly different the Manitoba Chiefs’ total compensation per registered member across 8 reserves in Manitoba. The highest paid per capita Chief of Buffalo Point makes $879 per...
Ontario First Nation Chiefs’ Wage Disparity
In the age of transparency, fairness, and equity this infographic demonstrates how spectacularly different the Ontario Chiefs’ total compensation per registered member across 15 reserves in Ontario. The highest paid per capita Chief of Mississauga’s of Scugog Island...
Quebec First Nations Chiefs’ Wage Disparity
FC085
Featured News
Traditional Teaching is not Obsolete
Artificial intelligence has come a long way. Unlike the rudimentary software of the past, modern-day programs such as ChatGPT are truly impressive. Whether you need a 1,000-word essay summarizing the history of Manitoba, a 500-word article extolling the virtues of...
Ottawa’s Policies Defeat Its Critical Minerals Push
Prime Minister Justin Trudeau made a recent rush visit to the Saskatchewan Research Council’s experimental rare earth refining facility in Saskatoon. He touted his government’s efforts to promote rare earth discovery, development, and extraction, along with the...
Rapid Wage Growth for Federal Public Servants
In 1991, federal public servants enjoyed a “pay premium” of 34% compared to the average weekly wage earned by individuals working in other occupations. In 2008, the gap was 59%. FC051
Fact Check on Greenhouse Gas Emissions
Some environmental activists criticize Canada for the fact that our total greenhouse gas emissions have increased over the past 20 years. However, examining total emissions is an overly simplistic approach to measuring progress, because this metric makes no provision for the fact that GHG emissions are tightly linked to population and economic growth. A better indicator is GHG intensity of economic activity, a statistic that does not punish economic growth. According to this indicator Canada has actually made significant progress over the past 20 years, reducing the GHG intensity of its economic activity by 18% since 1990. This indicator clearly shows that the widespread perception that Canada has made no progress toward controlling its GHG emissions is mistaken. FC050
A Few Hot Summer Facts to Think About on Fresh Water Use in Canada — and the Rest of the World
As a percentage of available renewable resources, Canada withdraws less of its water each year than the overwhelming majority of countries in the world, including European nations such as Germany and France. Canada’s per capita water consumption is high, but is sustainable in light of our large natural supply of freshwater. FC049
Winnipeg’s Low Property Taxes and Municipal Revenue
Winnipeg has surprisingly low taxes, user fees, higher government grants and overall revenue compared to other major Prairie cities. FC048
Canada’s Taxi Markets: Market Failure or Regulatory Failure?
A new Charticle compares Calgary, Winnipeg and Regina population growth to the number of taxi licenses and observes we have many fewer taxis than we might expect based on population and employment growth in the past two decades. FC047
Manitoba – Canada’s Biggest Provincial Landlord
Another Downside of Rent Control. FC045
Education Inflation in Canada
Alberta spent the most per student, followed closely by Manitoba. However, Alberta had the least expensive education system when expenditures are measured as a percent of its economy. The most expensive system by that measure is New Brunswick, followed closely by Manitoba’s.
Municipal Salary and Benefit Expense
This Frontier Charticle presents the percentage of expenditure that was declared as Salaries and Benefits in the Expenditure by Object sections of the municipalities’ 2005 financial statements. FC043
Real City Crisis is Weak Asset Management
Asset management practice within Canadian local government remains an optional extra. FC041