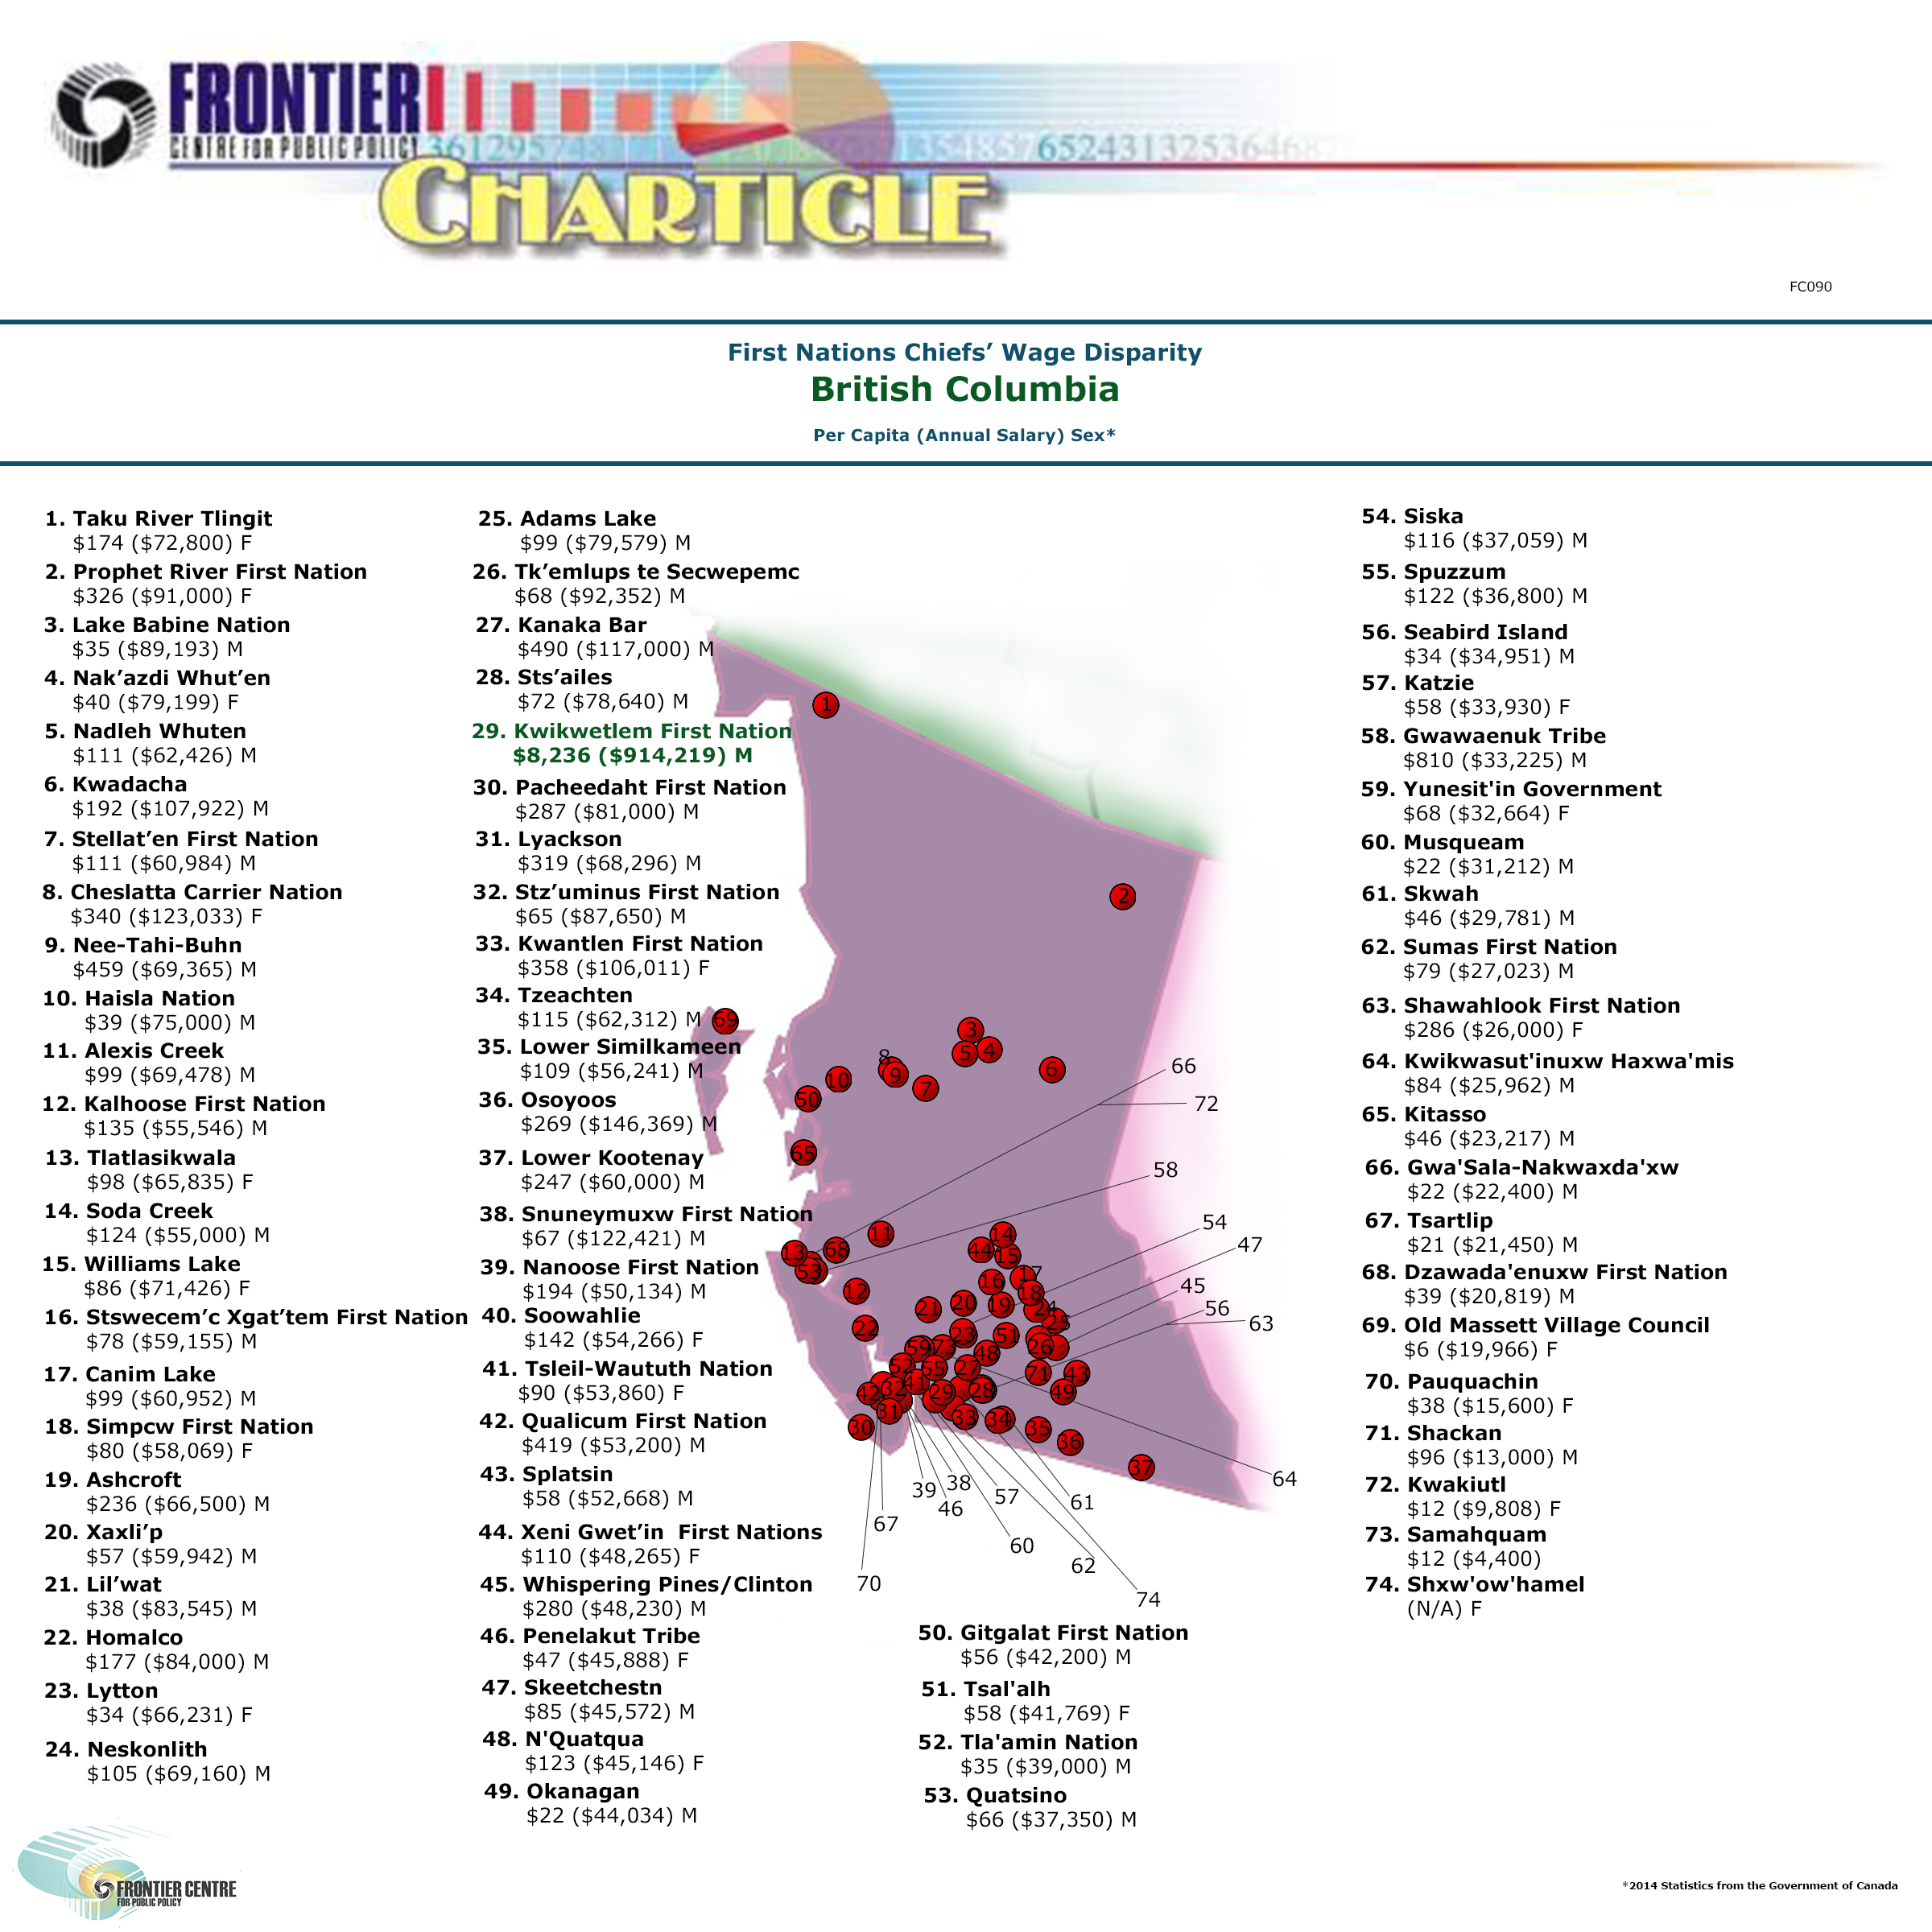
In the age of transparency, fairness, and equity this infographic demonstrates how spectacularly different the British Columbia Chiefs’ total compensation per registered member across 74 reserves in British Columbia. The highest paid per capita Chief of Kwikwetlem...