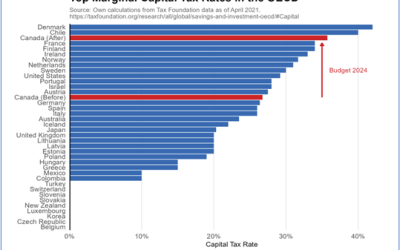
Canada Now has the Third Highest Global Capital Gains Tax Rate The April 16th federal budget increased Canada’s inclusion rate for capital gains, sharply moving Canada up in the effective marginal capital gains tax rate versus rival nations. According to...
Results for "charticle"
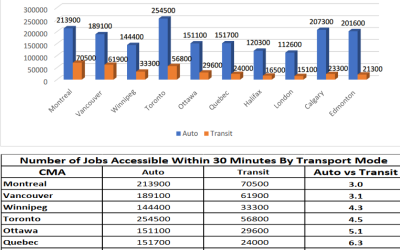
Multiple More Jobs Accessible by Automobile than By Transit
• A recent University of Toronto paper by Jeff Allen and Steven Farber examines work access as measured in travel time to get to work. The “30-minute job access” is a rounded-up average in all heavily populated regions in Canada. • The 2021 census revealed that...
Index
Research PortfoliosAboriginal FuturesAgricultureAirportsChildcareChristmasCivil LibertiesClimateCore Public Sector ReformCOVID-19Crown CorporationsCulture WarsDisruptionEconomyEducationEnergyEnvironmentEqualizationForeign AffairsFree...
British Columbia – Canadian Provincial Healthcare Expenditure Analyses – How Bad Is It, Really?
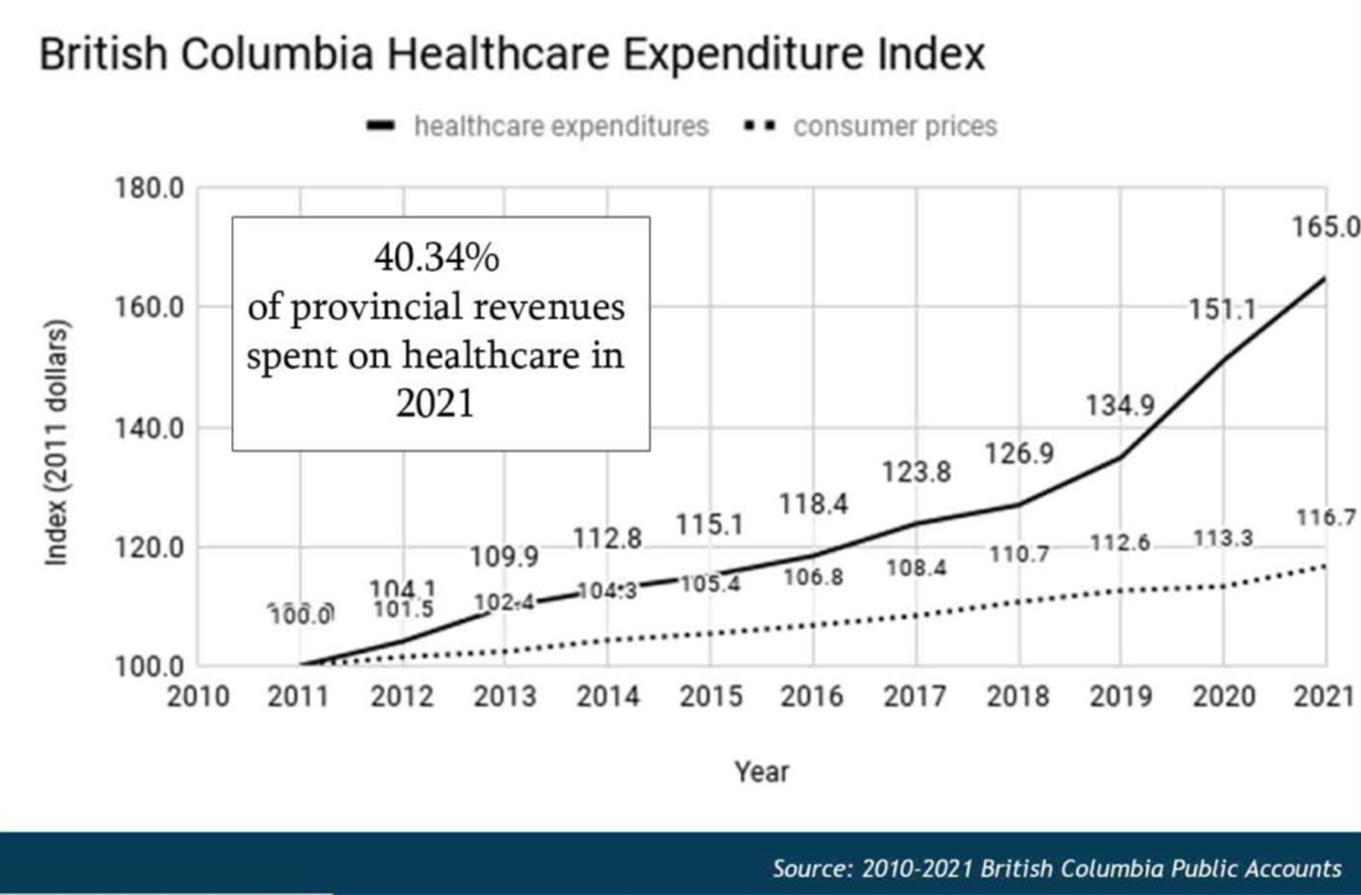
Healthcare Expenditure BC healthcare expenditures have outpaced the Canadian Consumer Price Index (CPI) The expenditures are 65% higher than in 2011 The 2020 COVID-19 outbreak caused the sharpest year-over-year increase in 10 years: 16.2% Expenditures more than...
Featured News
Canadian Property Rights Index 2023
A Snapshot of Property Rights Protection in Canada After 10 years
Alberta Politics and Empty Promises of Health-care Solutions
The writ has been dropped and Albertans are off to the polls on May 29. That leaves just four weeks for political leaders and voters to sort out what is arguably the most divisive, yet significant, issue for this election - health care. On Day 2, NDP leader Rachel...
Manitoba – Canadian Provincial Healthcare Expenditure Analyses – How Bad Is It, Really?
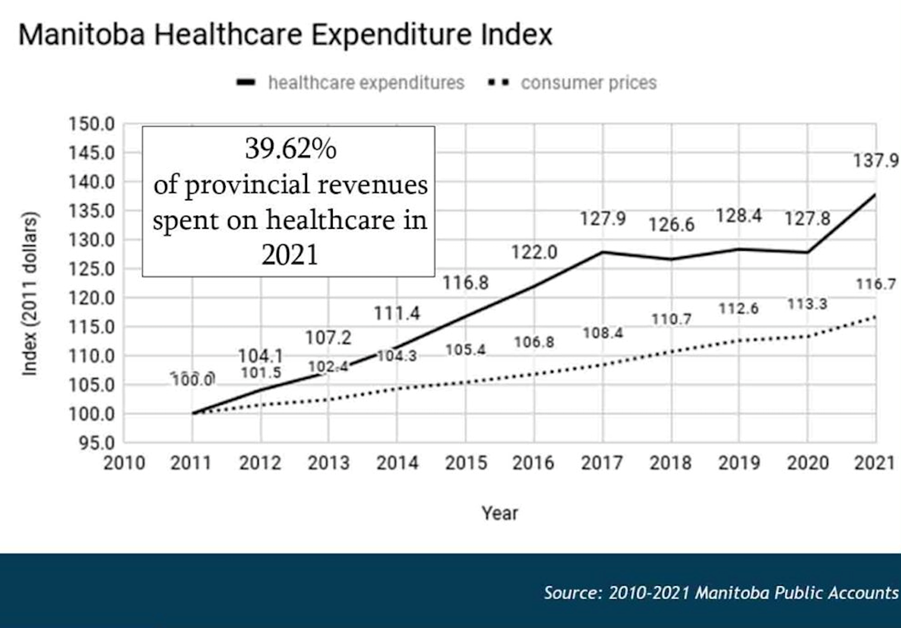
Healthcare Expenditure Over the last ten years, Manitoba healthcare spending has increased three times the growth rate of the Canadian Consumer Price Index (CPI), by 37.9% between 2011 and 2021 From 2011 to 2017, an increase of 27.9% was recorded, followed by...
Saskatchewan – Canadian Provincial Healthcare Expenditure Analyses – How Bad Is It, Really?
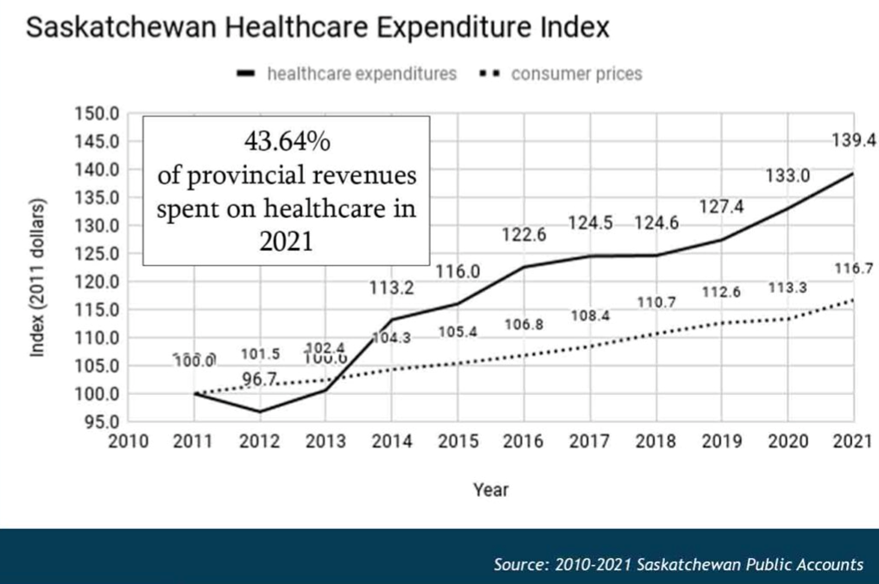
Healthcare Expenditure Over the past ten years, Saskatchewan’s healthcare expenditure has outpaced the growth rate of the Canadian Consumer Price Index (CPI) threefold More specifically, Saskatchewan has increased its healthcare spending by 39.4% between 2011...
Alberta – Canadian Provincial Healthcare Expenditure Analyses – How Bad Is It, Really?
Healthcare Expenditure Alberta healthcare expenditures have outpaced the Canadian Consumer Price Index (CPI) by more than three times the average rate of 5.4% between 2011 and 2018 2018 expenditures slightly declined from the overall high of 38% between 2018 and 2017,...
Cold Temperature Extremes are Rising
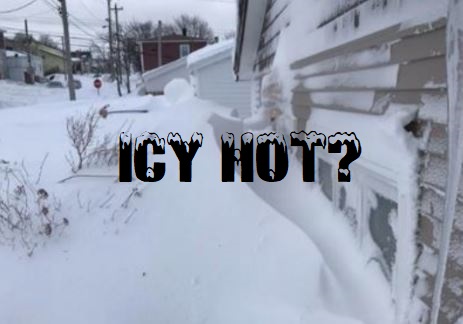
GRAPHICAL ANALYSIS FROM THE FRONTIER CENTRE FOR PUBLIC POLICY Climate closely correlates with solar activity accounting for 80% of the trend over a 150-year period unlike C02. April 2020 over the Canadian prairies was the third coldest since 1985 averaging 3°C below...
British Columbia First Nation Chiefs’ Wage Disparity
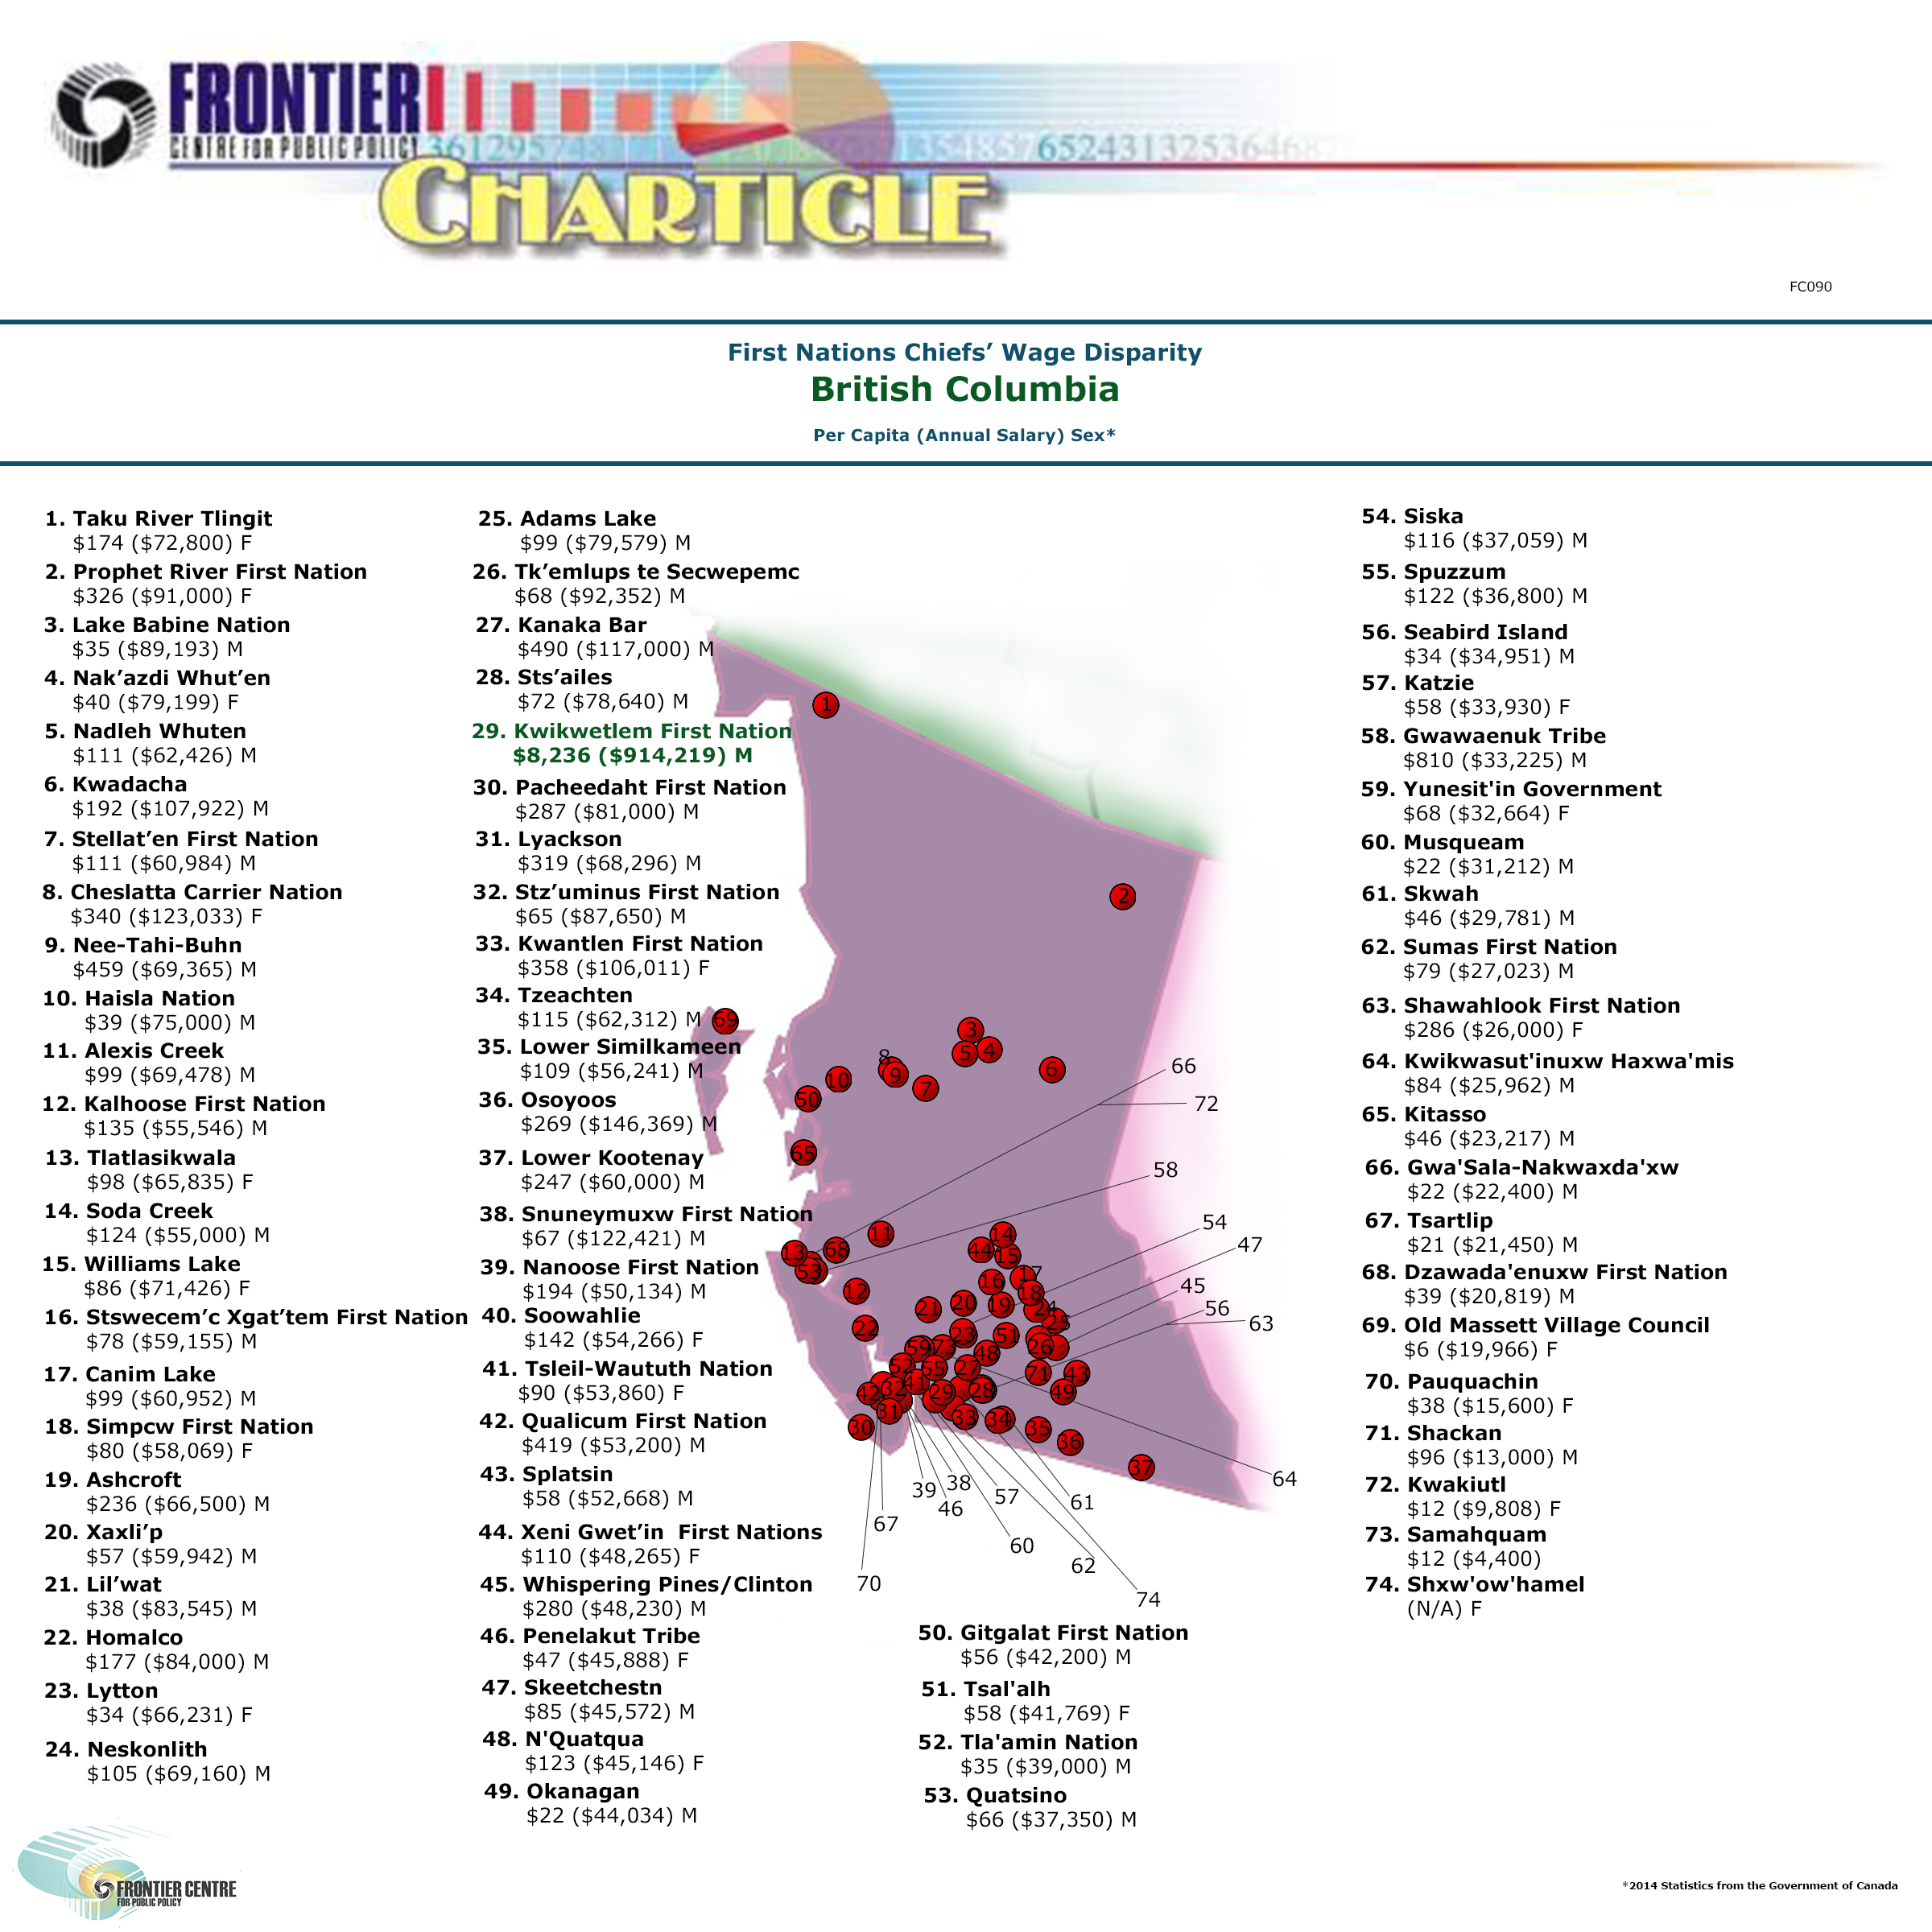
In the age of transparency, fairness, and equity this infographic demonstrates how spectacularly different the British Columbia Chiefs’ total compensation per registered member across 74 reserves in British Columbia. The highest paid per capita Chief of Kwikwetlem...
Alberta First Nation Chiefs’ Wage Disparity
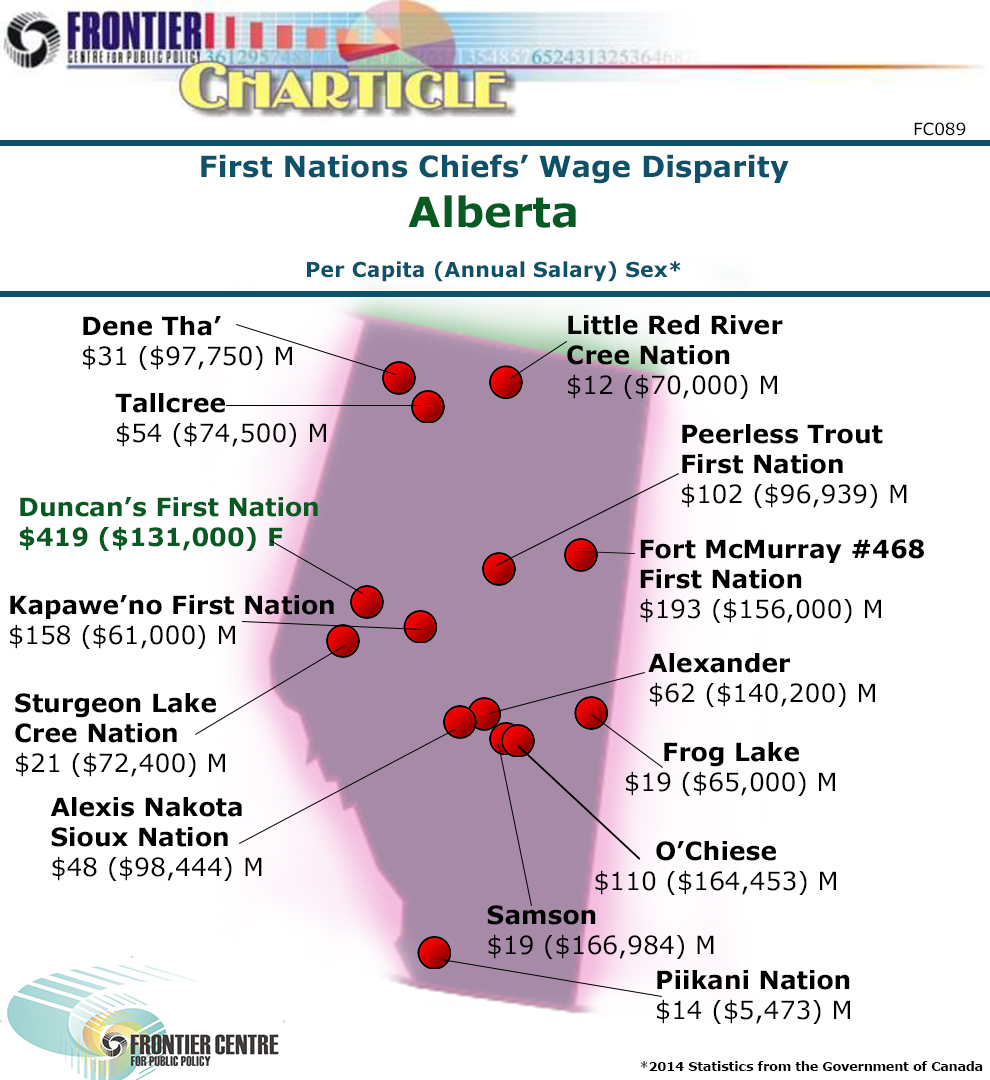
In the age of transparency, fairness, and equity this infographic demonstrates how spectacularly different the Alberta Chiefs’ total compensation per registered member across 15 reserves inAlberta. The highest paid per capita Chief of Duncan’s First Nation makes $419...
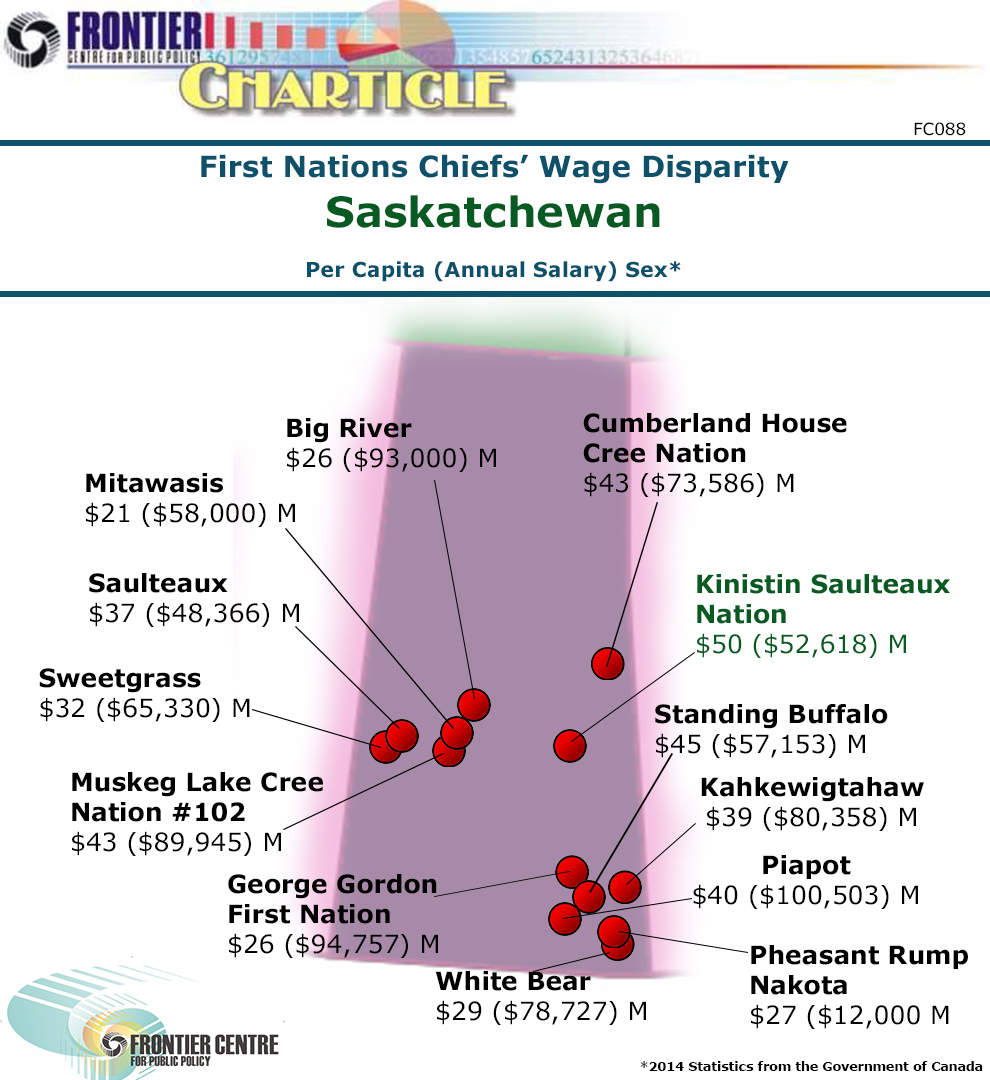
Saskatchewan Chiefs’ Wage Disparity
In the age of transparency, fairness, and equity this infographic demonstrates how spectacularly different the Saskatchewan Chiefs’ total compensation per registered member across 13 reserves in Saskatchewan. The highest paid per capita Chief of Kinistin Saulteaux...
Publications
The Frontier Centre achieves high visibility and impact on the public dialogue through a variety of information products available to the general public:
Manitoba Hydro: Worst Transparency in Canada
Annual reports are an essential tool in the public’s ability to analyze companies performance. This charticle demonstrates the transparency of Canadian energy companies based on public access to their annual report data online. This simple analysis of the...
